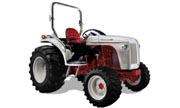
| New Holland Boomer 8N | VS | All other Farm Tractors |
| Production | |||||
|---|---|---|---|---|---|
| Model Year | 2009 | ||||
| Production Manufacturer | New Holland | vs | 13.1% Farm Tractors have New Holland |
||
| Original price (USD) | $30, 000 (2009) | ||||
| Capacity | |||||
|---|---|---|---|---|---|
| Capacity Fuel |
13 gal (57.35 gal lower than average)
|
vs |
70.35 gal
|
||
| Power Take-off (PTO) | |||||
|---|---|---|---|---|---|
| Rear PTO | Independent | vs | 78.6% Farm Tractors have independent |
||
| Mid PTO | Optional | vs | 53.5% Farm Tractors have optional |
||
| Mechanical | |||||
|---|---|---|---|---|---|
| Mechanical Steering | Hydrostatic Power | vs | 81.1% Farm Tractors have hydrostatic power |
||
| Chassis | 4x4 Mfwd 4wd | vs | 52.8% Farm Tractors have 4x4 MFWD 4WD |
||
| Brakes | Integral Wet Disc | vs | 0.3% Farm Tractors have integral wet disc |
||
| Cab | Two-post Rops. Optional Rops Canopy With Windshield. | ||||
| Transmission | |||||
|---|---|---|---|---|---|
| Transmission Type | Continuously Variable Transmission (cvt) | vs | 1.5% Farm Tractors have continuously variable transmission (CVT) |
||
| Transmission Gears | Infinite Forward And Reverse | ||||
| Transmission Speeds | |||||
| Dimensions | |||||
|---|---|---|---|---|---|
| Dimensions Width | 68.3 Inches [173 Cm] (minimum) | ||||
| Wheelbase |
73.5 inches (20.83 inches lower than average)
|
vs |
94.33 inches
|
||
| Length |
122 inches (39.96 inches lower than average)
|
vs |
161.96 inches
|
||
| Height (ROPS) |
97.4 inches (3.26 inches higher than average)
|
vs |
94.14 inches
|
||
| Hydraulics | |||||
|---|---|---|---|---|---|
| Hydraulics Type | Open Center | ||||
| Pressure |
2500 psi (2498 psi higher than average)
|
vs |
2,737 psi
|
||
| Valve flow |
10.5 gpm (6.58 gpm lower than average)
|
vs |
17.08 gpm
|
||
| Steering flow |
5.1 gpm (1.74 gpm lower than average)
|
vs |
6.84 gpm
|
||
| 3-Point Hitch | |||||
|---|---|---|---|---|---|
| Rear Type |
I (36.36 lower than average)
|
vs | 26.5% Farm Tractors have I |
||
| Rear lift |
2800 lbs (2789 lbs higher than average)
|
vs |
11,787 lbs
|
||
| Power | |||||
|---|---|---|---|---|---|
| PTO (claimed) |
40 hp (72.68 hp lower than average)
|
vs |
112.68 hp
|
||
| Engine |
50 hp (97.82 hp lower than average)
|
vs |
147.82 hp
|
||
| Tires | |||||
|---|---|---|---|---|---|
| Ag front | 8.0x16 | ||||
| Ag rear | 14.9x24 | ||||
| Lawn/turf front | 27x10.5-15 | ||||
| Lawn/turf rear | 44x18-20 | ||||
| Industrial front | 10x16.5 | ||||
| Industrial rear | 17.5x24 | ||||
