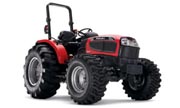
| Mahindra 5035 | VS | All other Farm Tractors |
| Production | |||||
|---|---|---|---|---|---|
| Model Year | 2010 | ||||
| Production Manufacturer | Mahindra | vs | 2.5% Farm Tractors have Mahindra |
||
| Factory | Maharashtra, India | ||||
| Capacity | |||||
|---|---|---|---|---|---|
| Capacity Fuel |
11.3 gal (59.05 gal lower than average)
|
vs |
70.35 gal
|
||
| Power Take-off (PTO) | |||||
|---|---|---|---|---|---|
| Rear RPMs |
540 (68.25 lower than average)
|
vs |
608.25
|
||
| Rear PTO | Independent | vs | 78.6% Farm Tractors have independent |
||
| Mechanical | |||||
|---|---|---|---|---|---|
| Mechanical Steering | Hydrostatic Power | vs | 81.1% Farm Tractors have hydrostatic power |
||
| Chassis | 4x4 Mfwd 4wd | vs | 52.8% Farm Tractors have 4x4 MFWD 4WD |
||
| Brakes | Wet Disc | vs | 40.8% Farm Tractors have wet disc |
||
| Cab | Foladable Rops. | ||||
| Transmission | |||||
|---|---|---|---|---|---|
| Transmission Type | Synchro Shuttle With Full Synchromesh | vs | 0.4% Farm Tractors have synchro shuttle with full synchromesh |
||
| Transmission Gears |
12 forward (3.13 forward lower than average)
|
vs |
15.13 forward
|
||
| Dimensions | |||||
|---|---|---|---|---|---|
| Dimensions Width |
75.5 inches (3.32 inches higher than average)
|
vs |
72.18 inches
|
||
| Weight (operating) |
4939 lbs (4921 lbs higher than average)
|
vs |
18,724 lbs
|
||
| Length |
128.9 inches (33.06 inches lower than average)
|
vs |
161.96 inches
|
||
| 4WD turn radius | 12 Feet [3.7 M] 10.33 Feet [3.1 M] (with Brakes) | ||||
| Hydraulics | |||||
|---|---|---|---|---|---|
| Hydraulics Type | Open Center | ||||
| Total flow |
11 gpm (13.65 gpm lower than average)
|
vs |
24.65 gpm
|
||
| Rear valves |
1 (1.55 lower than average)
|
vs |
2.55
|
||
| Steering flow |
5 gpm (1.84 gpm lower than average)
|
vs |
6.84 gpm
|
||
| Loader | |||||
|---|---|---|---|---|---|
| Loader Weight |
1450 lbs (280.69 lbs higher than average)
|
vs |
1169.31 lbs
|
||
| Loader Loader type | Mahindra Ml 130 | ||||
| Loader Height (to pin) |
111.5 inches (5.2 inches lower than average)
|
vs |
116.70 inches
|
||
| Loader Dump clearance |
92 inches (1.02 inches higher than average)
|
vs |
90.98 inches
|
||
| Loader Dump reach |
24.75 inches (5.13 inches lower than average)
|
vs |
29.88 inches
|
||
| Loader Dump angle |
40 (9.06 lower than average)
|
vs |
49.06
|
||
| Loader Rollback angle |
20 (14.08 lower than average)
|
vs |
34.08
|
||
| Loader Lift to full height (at pin) |
2700 lbs (2698 lbs higher than average)
|
vs |
2,412 lbs
|
||
| Loader Bucket capacity |
0.63 cu (0.23 cu higher than average)
|
vs |
0.40 cu
|
||
| Loader Bucket width |
75 inches (9.08 inches higher than average)
|
vs |
65.92 inches
|
||
| Loader Breakout force (at pin) |
5100 lbs (5097 lbs higher than average)
|
vs |
3,719 lbs
|
||
| Loader Raise time to height |
5.7 s (1.37 s higher than average)
|
vs |
4.33 s
|
||
| Loader Bucket dump time |
4.9 s (2.15 s higher than average)
|
vs |
2.75 s
|
||
| Loader Lowering time |
4.3 s (1.14 s higher than average)
|
vs |
3.16 s
|
||
| Backhoe | |||||
|---|---|---|---|---|---|
| Backhoe Weight |
1487 lbs (418.58 lbs higher than average)
|
vs |
1068.42 lbs
|
||
| Backhoe Backhoe type | Mahindra 595 | ||||
| Backhoe Digging depth |
115 inches (20.94 inches higher than average)
|
vs |
94.06 inches
|
||
| Backhoe Bucket force |
5710 lbs (5707 lbs higher than average)
|
vs |
3,376 lbs
|
||
| Backhoe Dipperstick force |
3188 lbs (3186 lbs higher than average)
|
vs |
2,098 lbs
|
||
| 3-Point Hitch | |||||
|---|---|---|---|---|---|
| Rear Type |
I (36.36 lower than average)
|
vs | 26.5% Farm Tractors have I |
||
| Rear lift |
3090 lbs (3079 lbs higher than average)
|
vs |
11,787 lbs
|
||
| Power | |||||
|---|---|---|---|---|---|
| PTO (claimed) |
43 hp (69.68 hp lower than average)
|
vs |
112.68 hp
|
||
| Engine |
49.5 hp (98.32 hp lower than average)
|
vs |
147.82 hp
|
||
| Electrical | |||||
|---|---|---|---|---|---|
| Charging system | Alternator | ||||
| Charging amps |
45 (66.12 lower than average)
|
vs |
111.12
|
||
| Tires | |||||
|---|---|---|---|---|---|
| Ag front |
9.5-20 (14.6 lower than average)
|
vs |
24.10
|
||
| Ag rear |
16.9-24 (7.89 lower than average)
|
vs |
24.79
|
||
| Industrial front | 14x17.5 | ||||
| Industrial rear | 19.5lx24 | ||||
| Battery | |||||
|---|---|---|---|---|---|
| Volts |
12 (equals average)
|
vs |
12.00
|
||
| Number |
1 (0.65 lower than average)
|
vs |
1.65
|
||
| Amp-hours |
96 (97.44 lower than average)
|
vs |
193.44
|
||
 Kubota MX5100
 Mahindra 5035
 Kubota L4400
Popular Items