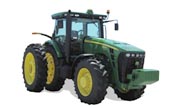
| John Deere 8320R | VS | All other Farm Tractors |
| Production | |||||
|---|---|---|---|---|---|
| Model Year | 2009 | ||||
| Production Manufacturer | John Deere | vs | 15.9% Farm Tractors have John Deere |
||
| Factory | Waterloo, Iowa, Usa | ||||
| Capacity | |||||
|---|---|---|---|---|---|
| Capacity Fuel |
180 gal (109.65 gal higher than average)
|
vs |
70.35 gal
|
||
| Hydraulic system | 40 Gal [151.4 L] 42 Gal [159.0 L] (ils) | ||||
| Power Take-off (PTO) | |||||
|---|---|---|---|---|---|
| Rear RPMs |
540 (68.25 lower than average)
|
vs |
608.25
|
||
| Rear PTO | Independent | vs | 78.6% Farm Tractors have independent |
||
| Mechanical | |||||
|---|---|---|---|---|---|
| Mechanical Steering | Hydrostatic Power | vs | 81.1% Farm Tractors have hydrostatic power |
||
| Chassis | 4x4 Mfwd 4wd | vs | 52.8% Farm Tractors have 4x4 MFWD 4WD |
||
| Brakes | Differential Hydraulic Wet Disc | vs | 7.8% Farm Tractors have differential hydraulic wet disc |
||
| Cab | Commandview Cab Standard With Heat And Air-conditioning. Optional Automatic Temperature Controls, Electronically-controlled Mirrors, Sun Shades, Instructor Seat, And Front/rear Windshield Wipers. | ||||
| Hydraulics | |||||
|---|---|---|---|---|---|
| Hydraulics Type | Closed Center Pressure-flow Compensated (pfc) | ||||
| Hydraulics Valves |
3 to (0.36 to higher than average)
|
vs |
2.64 to
|
||
| Pressure |
2900 psi (2898 psi higher than average)
|
vs |
2,737 psi
|
||
| Capacity (cu. ft.) | 40 Gal [151.4 L] 42 Gal [159.0 L] (ils) | ||||
| Valve flow |
35 gpm (17.92 gpm higher than average)
|
vs |
17.08 gpm
|
||
| Total flow |
44 (19.35 higher than average)
|
vs |
24.65
|
||
| 3-Point Hitch | |||||
|---|---|---|---|---|---|
| Rear Type | IVN/III | ||||
| Rear lift |
18300 lbs (18289 lbs higher than average)
|
vs |
11,787 lbs
|
||
| Front Hitch | Optional With Ils | ||||
| Front lift |
11000 lbs (10993 lbs higher than average)
|
vs |
7,658 lbs
|
||
| Power | |||||
|---|---|---|---|---|---|
| PTO (claimed) |
263 hp (150.32 hp higher than average)
|
vs |
112.68 hp
|
||
| PTO (tested) |
307.31 hp (130.06 hp higher than average)
|
vs |
177.25 hp
|
||
| Drawbar (tested) |
242.32 hp (78.37 hp higher than average)
|
vs |
163.95 hp
|
||
| Engine (gross) |
320 hp (224.85 hp higher than average)
|
vs |
95.15 hp
|
||
| Engine (net) |
307 hp (178.78 hp higher than average)
|
vs |
128.22 hp
|
||
| Electrical | |||||
|---|---|---|---|---|---|
| Ground | Negative | ||||
| Charging system | Alternator | ||||
| Charging amps |
200 (88.88 higher than average)
|
vs |
111.12
|
||
| Battery | |||||
|---|---|---|---|---|---|
| Volts |
12 (equals average)
|
vs |
12.00
|
||
| Number |
2 (0.35 higher than average)
|
vs |
1.65
|
||
| Cold-cranking amps |
925 (86.48 higher than average)
|
vs |
838.52
|
||
| Variants | |||||
|---|---|---|---|---|---|
| 8320RT | Crawler Tractor | ||||
